Key information:

What matters is the quality of the batch data that becomes the basis for analysis
The power of Genearative AI systems and the affordability of their application in everyday life are making them the driving force behind the most technologically advanced economies. In our view, the essence of these solutions lies in their ability to analyze truly vast amounts of information to make inferences about the current or future situation based on them.
However, the issue of the quality of the data that becomes the basis for analysis can become a problem when working with AI systems. If we ensure that the data is at a high enough level, we can be sure that the models leading to inference will work properly, making predictions based on the defined algorithm.
In the case of uncertain or even false data, the results of such inference can be inconsistent with reality and even, in extreme cases, dangerous. We therefore recommend great caution in working with analytical systems dictated by concern for the quality of batch data, which is the driving force behind system decisions.

Potential and opportunities for safe use of learning systems
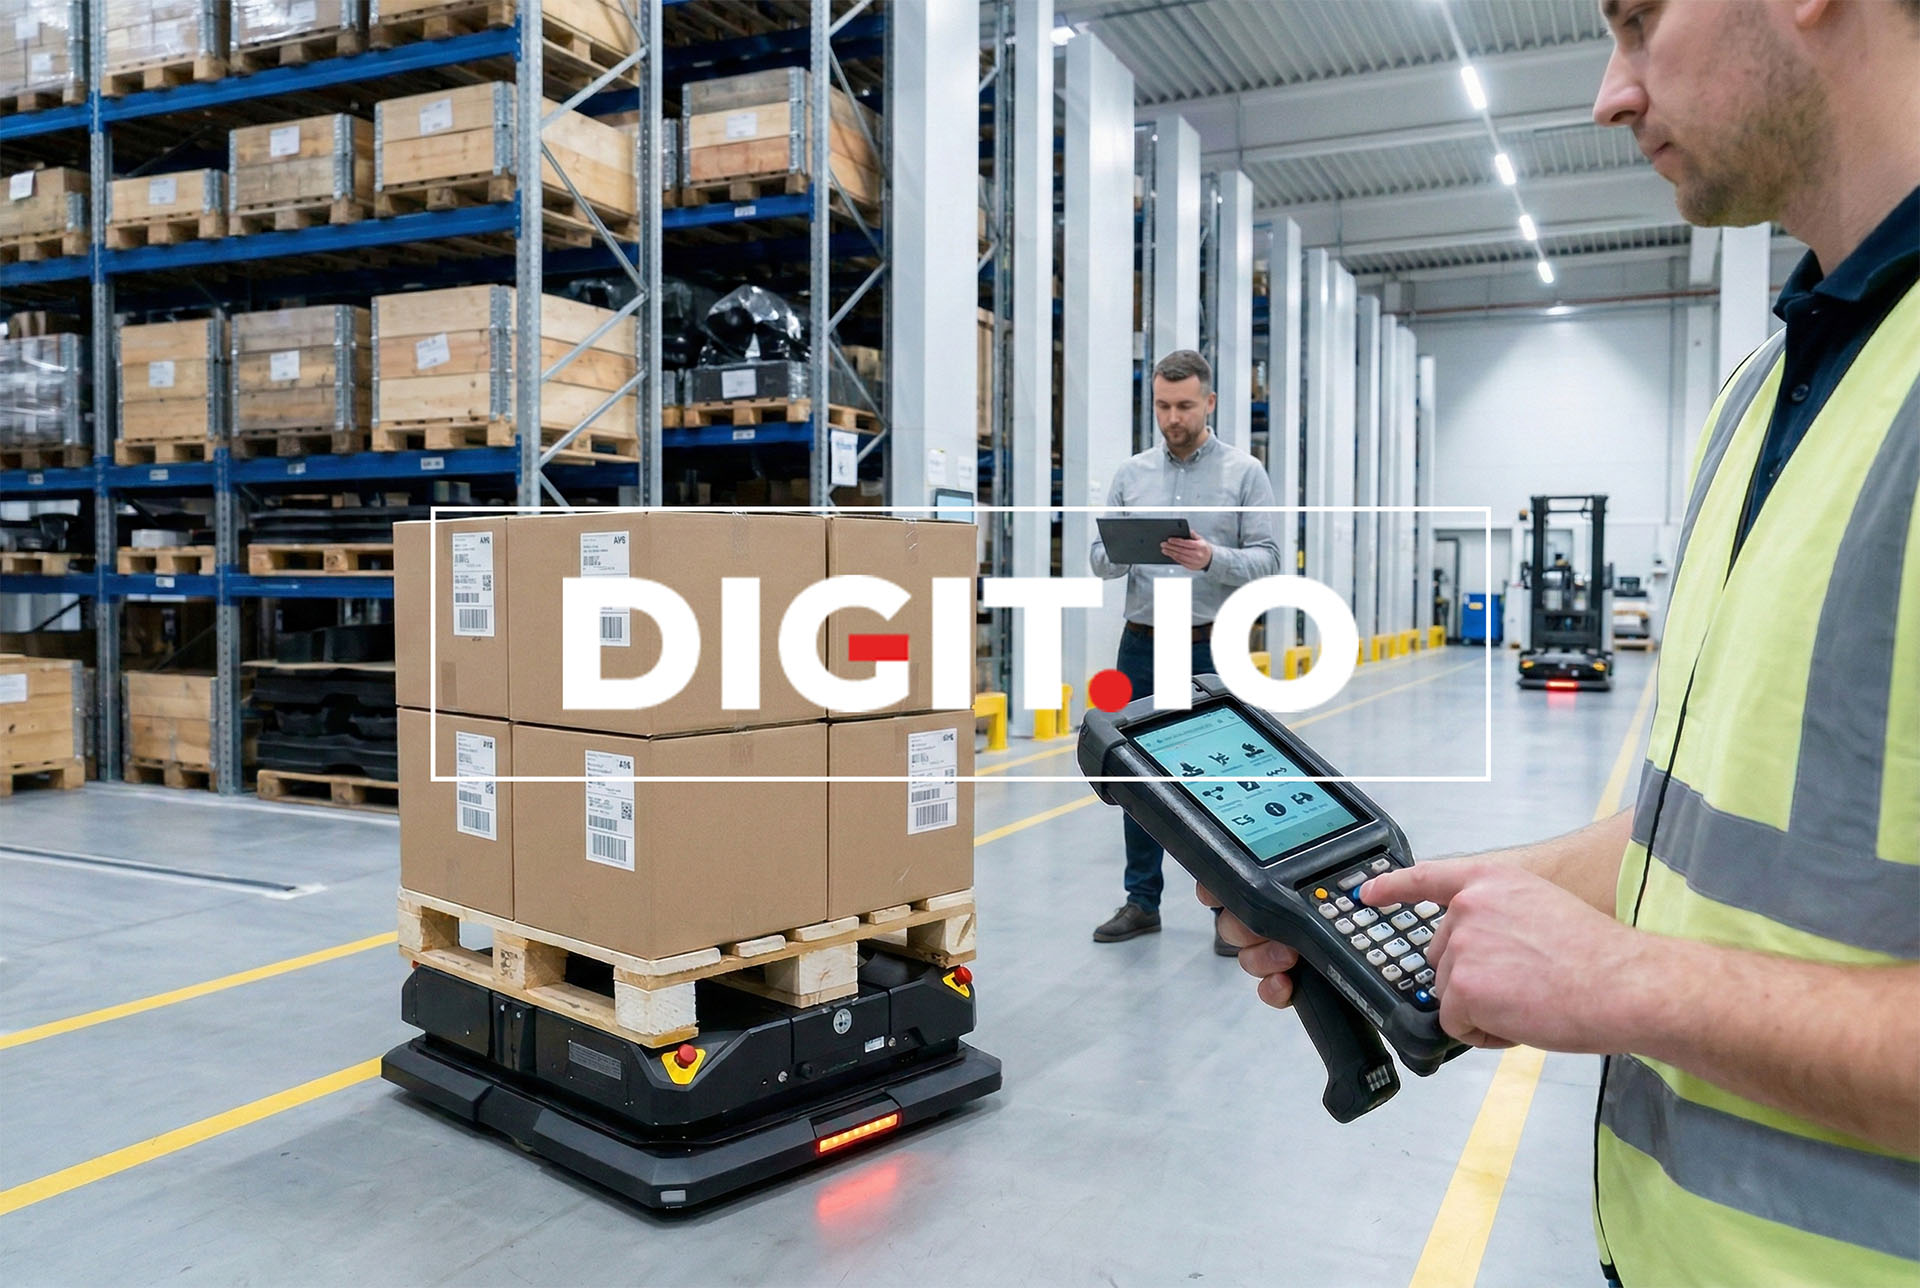
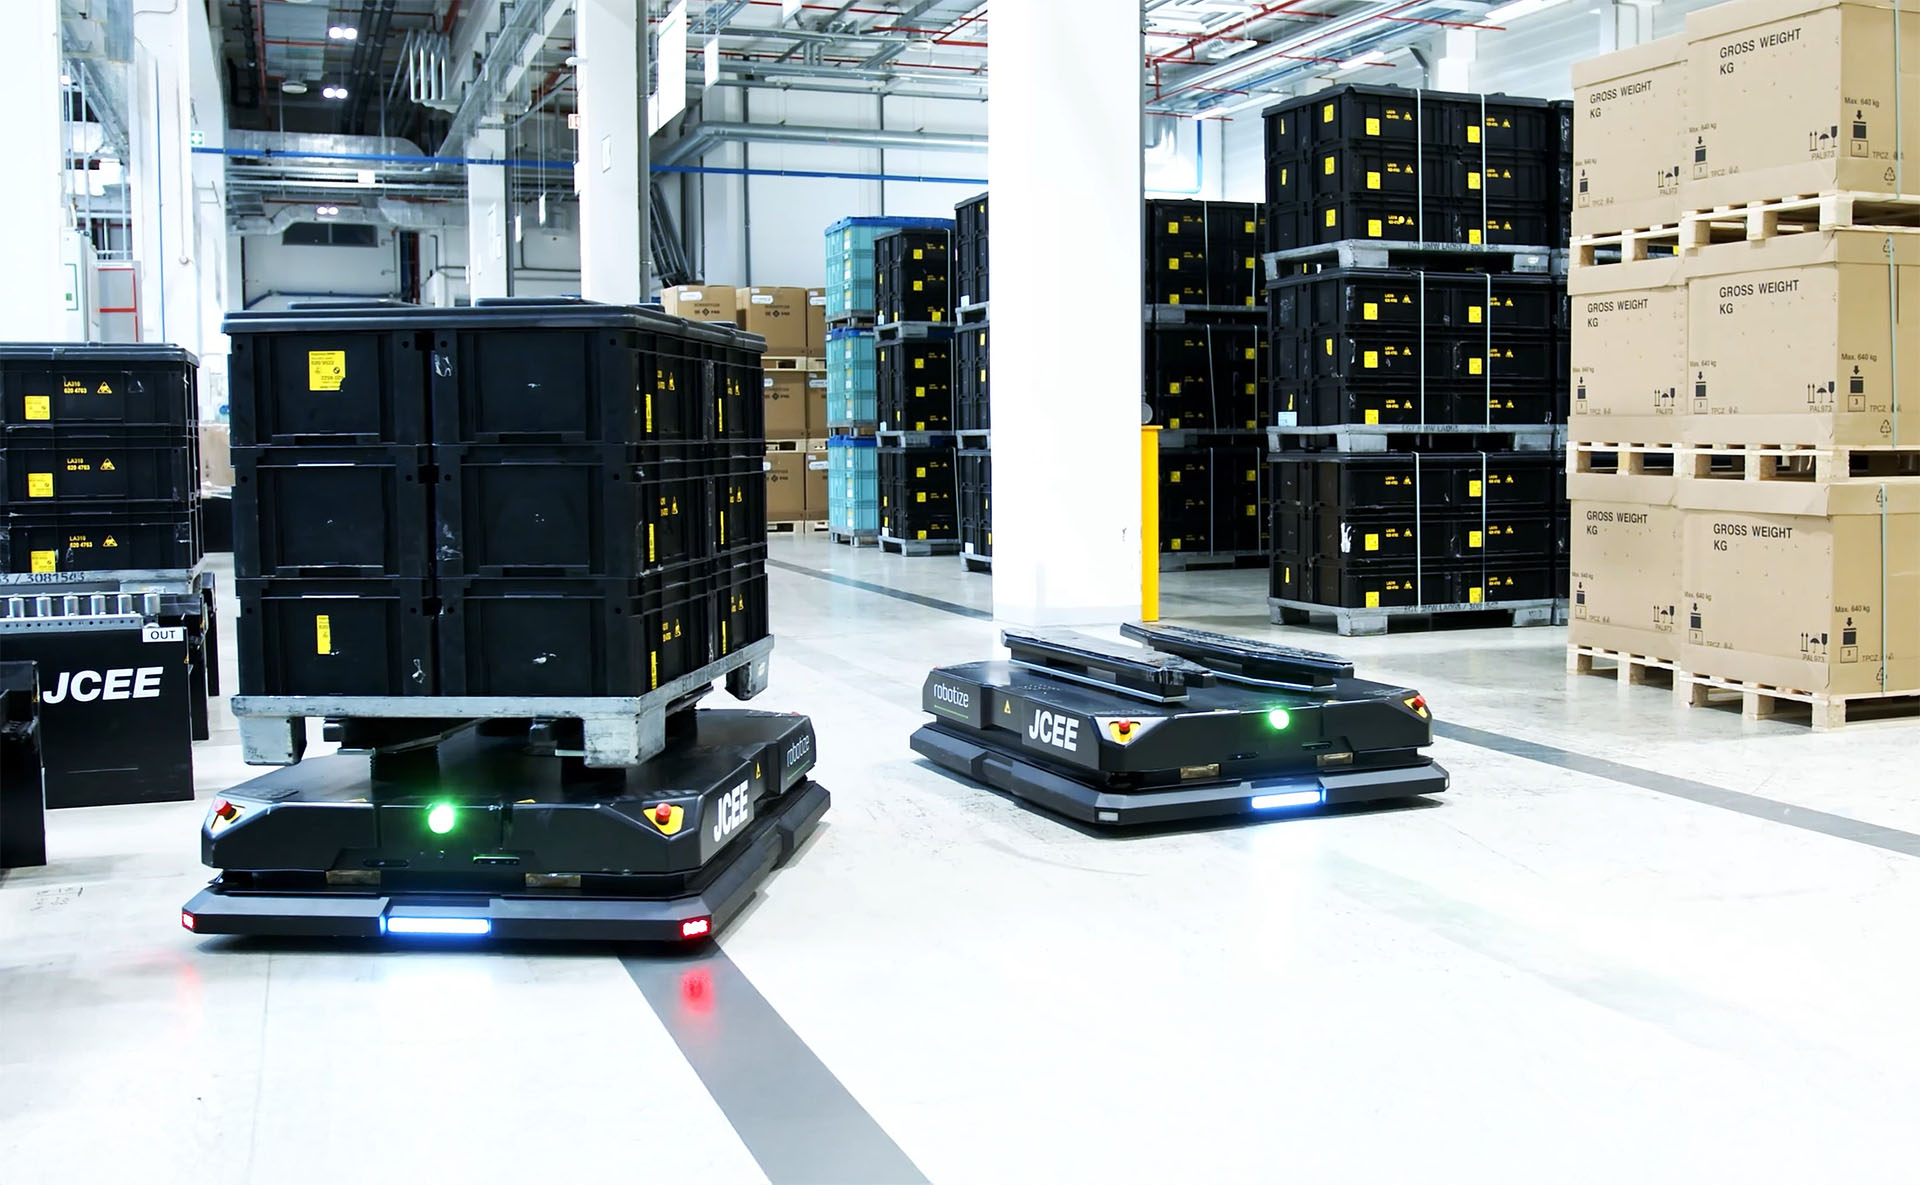
HKK Group specialists are looking to apply elements of generative artificial intelligence wherever our core competencies lie, namely in the world of manufacturing logistics. We model decision support systems in our WMS system, especially in the area of selecting the most efficient picking methods .
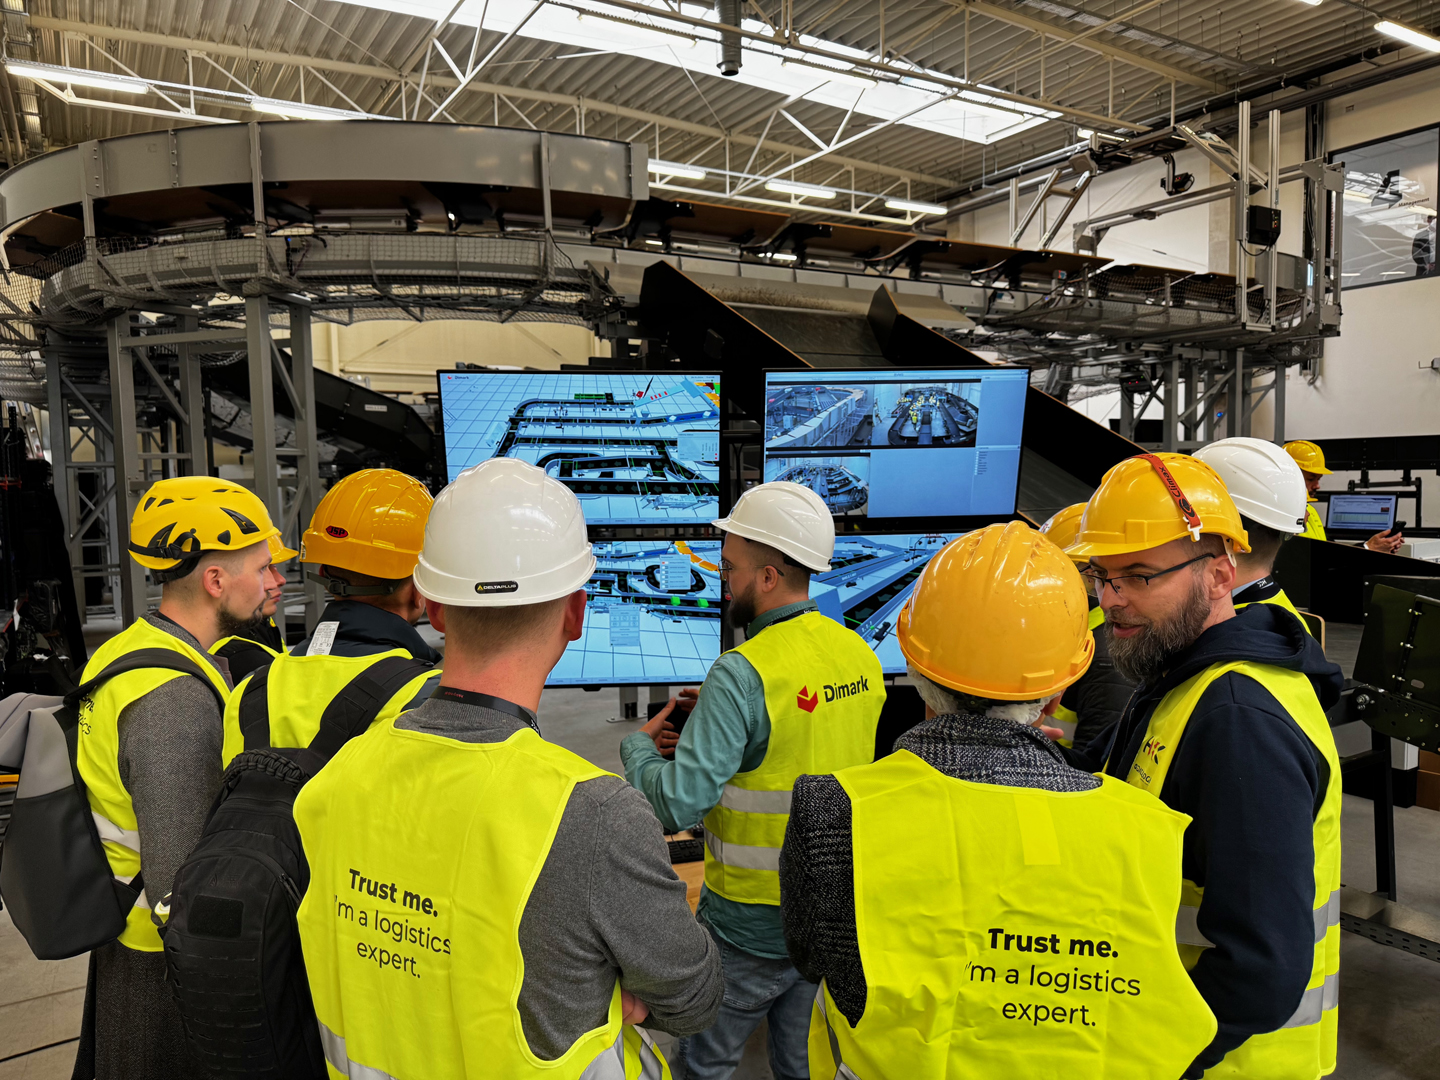
We are also working on the application of models digital twin for manufacturing processes, to enable in-depth analysis of alternative decision cases. The goal is to find the optimal scenario without affecting the real production or logistics environment.
Our activities correspond with one of the core competencies of our Consultants, namely the area of automated data collection.
Such a unique juxtaposition of specializations (on the one hand, a dataset, and on the other hand, the ability to program decision-making algorithms that operate on the basis of previously collected data) make the systems we design infer on the basis of the highest quality data, which positively affects the possibility of their use in a production environment.
The systems we design conclude on the basis of the highest quality data, which positively affects the possibility of their use in the production environment.We are talking about solutions such as WMS, Digital Twin and automatic identification.

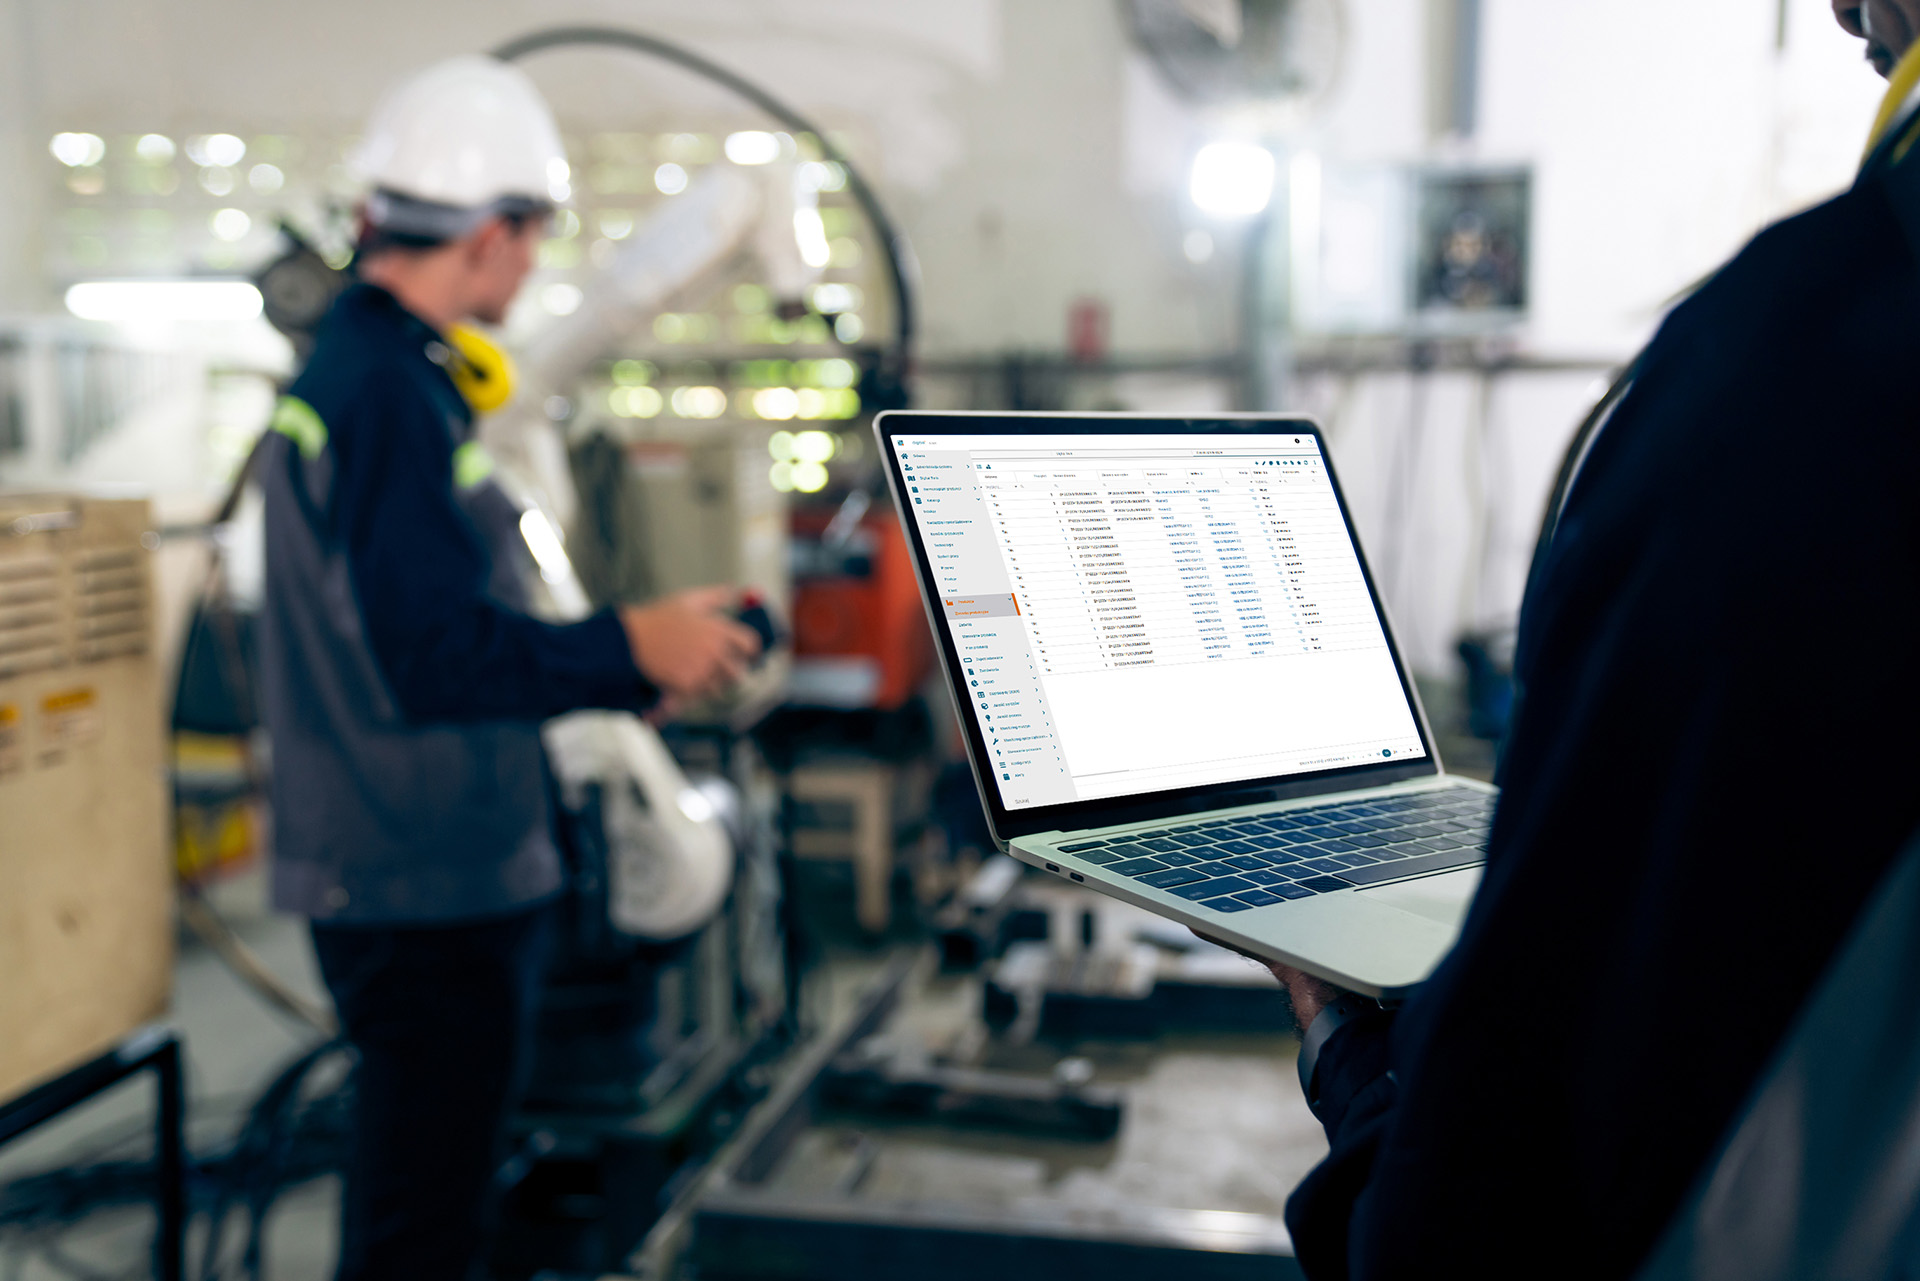
A little practice - intelligent production control in DigitIO system
In the DT creation support system (decision creation), decisions on the quality of the manufacturing process are made on the basis of data provided from the inspection carried out on-line and in-line, and in special cases after the completed operation (off-line).
In its assumptions, the suite of methods allows the analysis of data such as product properties, process parameters, diagnostic signals accompanying the process and events that occurred during the process. The collection of such data is the starting point for creating a model of the process state, on the basis of which future states of the process are predicted and corrective decisions are made.
From the point of view of the analysis, it was important to determine the structure of the data in the Data Analysis Module (labeled MAD). It is shown in Figure 1 placed below.
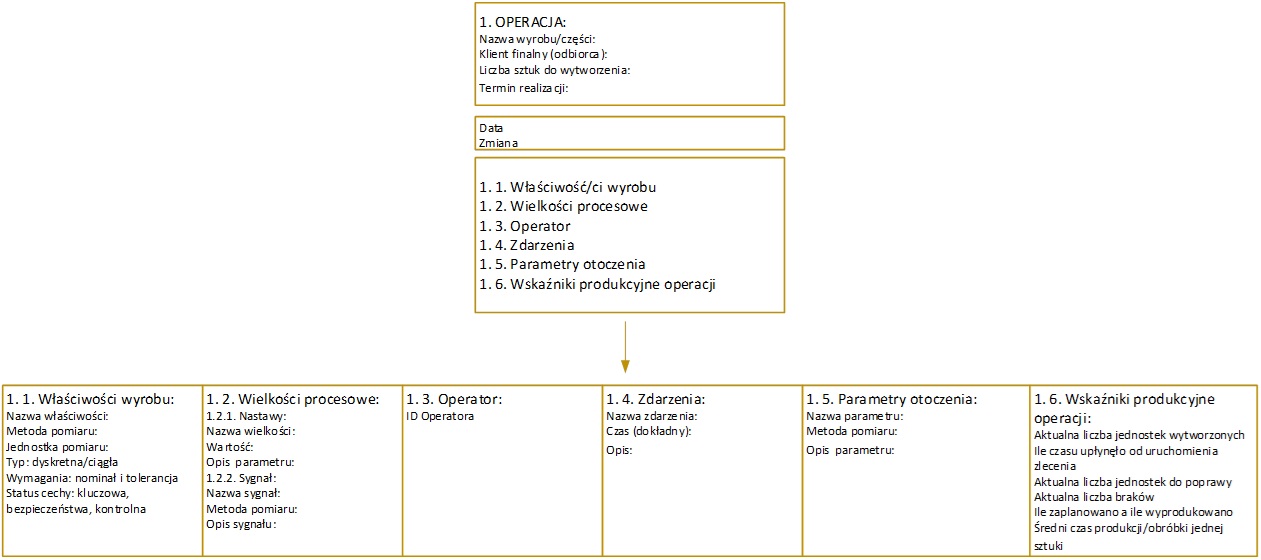
Figure 1: The idea behind the data structure in MAD
The data on the basis of which analyses are performed in MAD is divided into 6 main classes, named:
- Product properties – is a class of properties related to the product/piece/material being machined. For example: the diameter of the workpiece being ground, the carbon content of the material, the number of scratches on the surface of the workpiece, and others.
- Process quantities – are features related to machine settings and signals accompanying the process. For example: cutting speed, saw feed, drying temperature and others.
- Operator – features related to the operator who operates the machine.
- Events – an event that occurs during the execution of the process. For example: chipping of the tool blade, blunting of the tool, voltage drop in the network, etc.
- Ambient parameters – are properties related to the environment. For example: ambient temperature, humidity, room airflow, etc.
- Production indicators – are the values of production indicators related to the current state of the order. E.g. OEE, productivity, non-conformance level, clock time, etc.
Data Analysis Module (MAD) of the Digit.IO system is divided into three sets of tools: monitoring, forecasting and modeling.
The following figure shows the analysis tools that are included in each module. The results of using each tool are stored in a database and can be visualized on the Data Analysis Dashboard (labeled PAD).
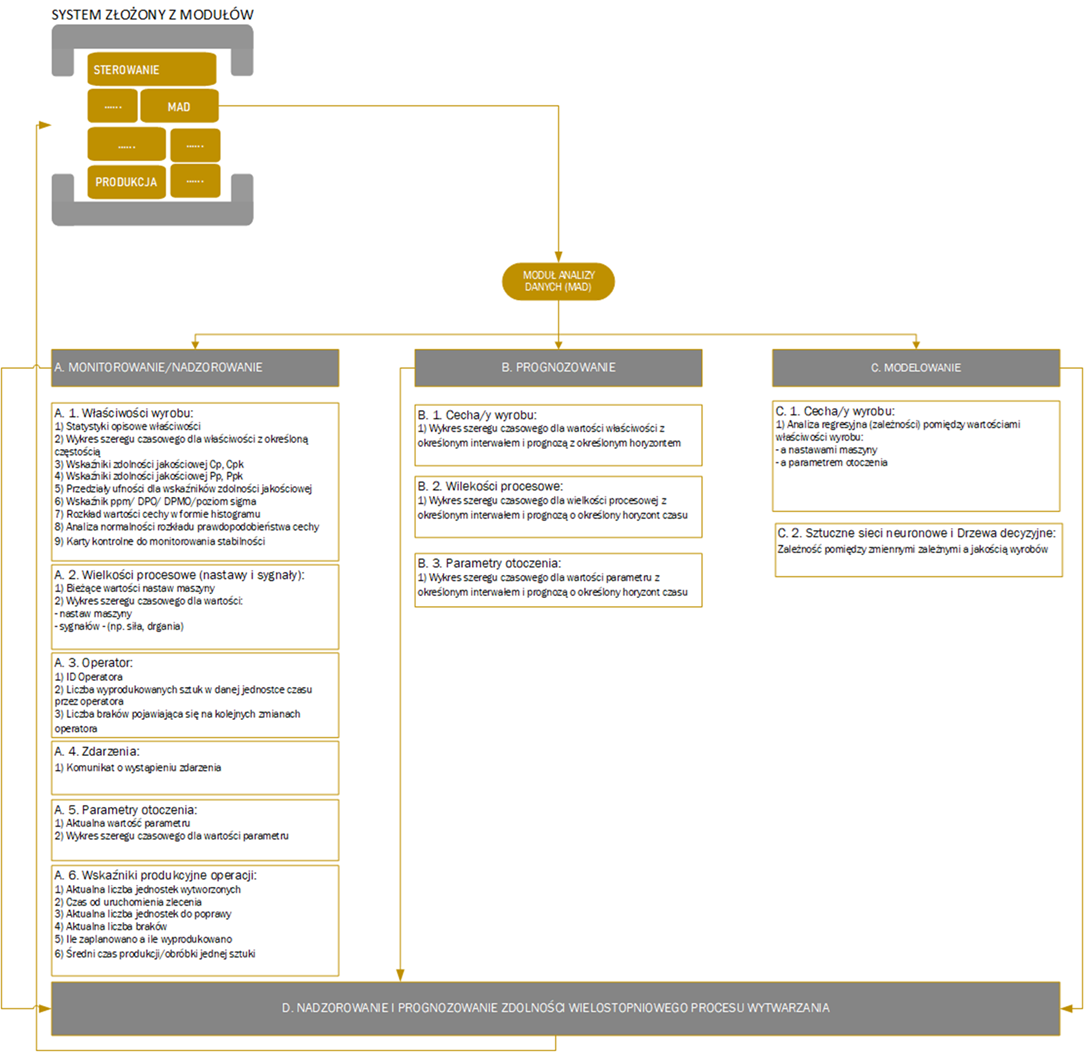
Figure 2: Groups of tools in the Data Analysis Module
The first group of tools (Figure 3) allows monitoring the value of product properties, process quantities, events, environmental parameters and production indicators. Their role boils down to taking a signal, possibly calculating an indicator and presenting the result in numerical or graphical form (e.g., a chart or icon).
Operator:
- Number of units produced in a given unit of time by a given operator
- Number of deficiencies appearing on successive operator shifts
Events:
- Information about the incident
Ambient parameters:
- The current value of the parameter
- Graph of the time series for the value of the parameter
Production indicators:
- Current number of units produced
- Time from order startup
- Current number of units to be improved
- Current number of deficiencies
- Average production/treatment time per piece
This group of tools included for:
Product features:
- Descriptive statistics of properties
- Time series graph for properties with a certain frequency
- Quality capacity indicators Cp, Cpk
- Quality capacity indicators Pp, Ppk
- Confidence intervals for qualitative capability indicators
- Ppm/ DPO/ DPMO/ sigma level indicator
- Distribution of feature values in the form of a histogram
- Analysis of normality of the probability distribution of a trait
- Control cards for stability monitoring
Process parameters:
- Current parameter values
- Time series graph for values of: a parameter (e.g., machine settings) or diagnostic signals from a process (e.g., force, vibration)

The second group of tools are forecasting tools (Figure 2). In this group, it is designed to perform forecasts based on time series analysis for the values of product properties, diagnostic signals and process capabilities.
The third group of tools is used for modeling that allows us to perform an analysis of the relationship between features. The purpose of modeling is to indicate for what values of parameters of the process, environment, events we will get the expected quality of the product.
For this purpose, the application of regression analysis, artificial neural networks and decision trees in discovering the relationship between dependent variables and product quality was designed.
The tool that is the bracket for the three groups is the author’s algorithm for supervising and predicting the quality capability of a multistage manufacturing process, which allows the determination of the risk of failure to meet process assumptions related to, for example, production flow. This risk can be expressed as the probability or number of units that will be defective or missing. This information is passed to the production flow planning module for the purpose, if necessary, of changing the production plan.